LiNK Advanced Analytics
Turn Every Handshake into Actionable Intelligence
Most business cards disappear into a drawer and are never seen again. LiNK’s built-in analytics dashboard changes that — turning every QR scan, profile view, and document download into data you can actually act on. Know who’s looking at your card, where they’re located, what they clicked, and when they were most active, so you can follow up at exactly the right moment.
Digital business card analytics, a real Return on Investment
Global Reach, Local Impact
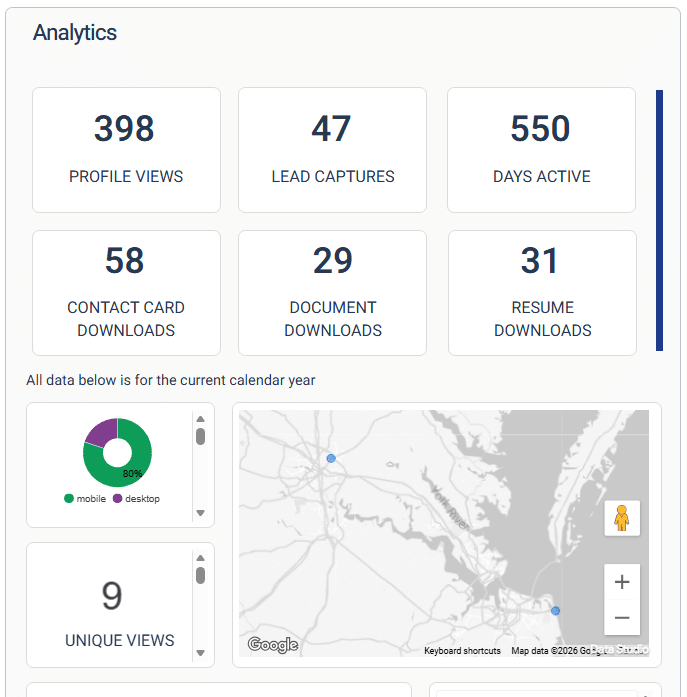
Geographic Footprint: View a live map of your networking “hot zones” to identify where your services are in highest demand.
Total Visibility: A high-level view of Total Scans gives you the raw reach of your networking efforts.
Engagement Depth: Track Average Session Duration to see how long prospects spend exploring your links, portfolio, and contact details.
Networking Trends & Tech Insights
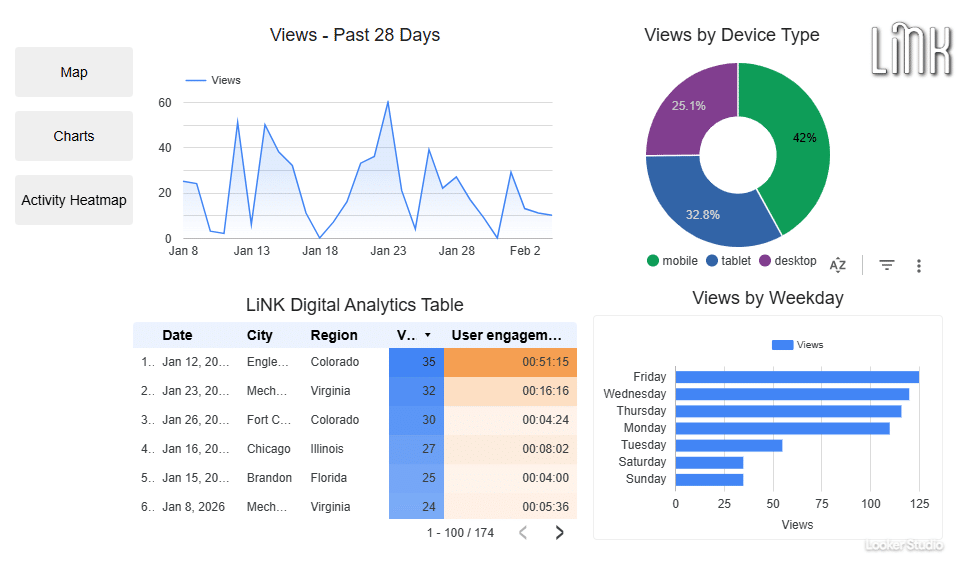
Growth Over Time: Track Daily View Trends to see the immediate impact of a conference, a social media post, or a specific networking event.
Interaction Velocity: Monitor Interactions Per Day to identify “engagement spikes”—helping you strike while the iron is hot and follow up when interest is at its peak.
Device Intelligence: See exactly what percentage of your audience uses iOS vs. Android. This allows you to optimize your contact-sharing strategy for the specific technology your prospects are holding.
Peak Performance Timing
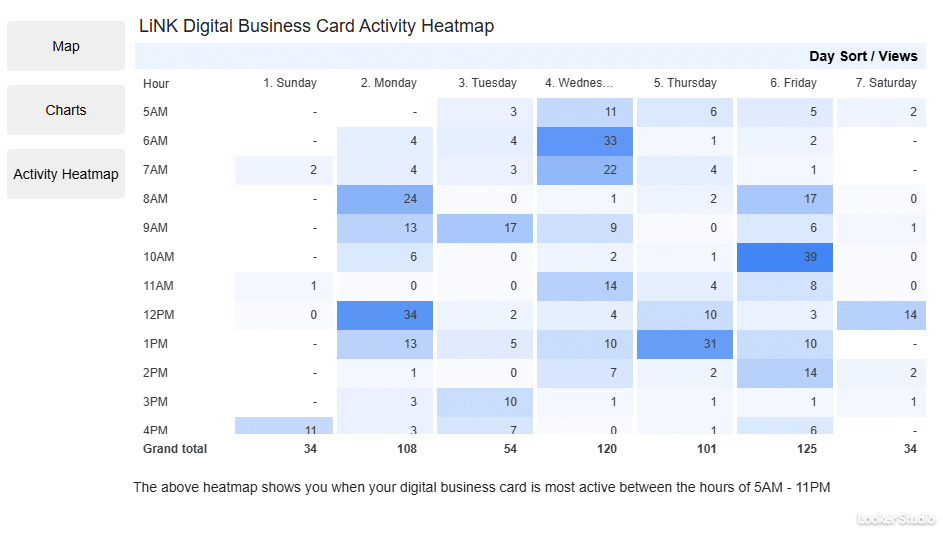
Engagement Hot Spots: Instantly identify your most productive networking windows. Whether it’s the “mid-conference rush” or “after-hours research,” you’ll see exactly when your audience is most active.
Strategic Follow-Ups: Use the heatmap to time your follow-up emails. Reaching out when your leads are historically most active on your card significantly increases your response rates.
Event ROI Analysis: Compare heatmaps across different dates to see which trade shows or networking mixers actually drove sustained interest versus a single momentary scan.
Networking with a Pulse
Networking happens on the move. Our dashboards are engineered for speed and vertical scrolling, so you can review your scan data between meetings or in the taxi.
Ready for a business card with real Networking ROI?
What analytics does LiNK track?
LiNK tracks every meaningful interaction your digital business card generates — including total profile views, unique visitor counts, lead captures, contact card downloads, document downloads, resume downloads, and average session duration. Beyond raw counts, the LiNK analytics dashboard shows you geographic location data, device type (iOS vs. Android), daily view trends, interactions per day, and a time-of-day activity heatmap. This gives you a complete picture of your networking performance, from how many people scanned your QR code to how long they spent exploring your profile and which files they accessed.
Can I see where my business card is being scanned geographically?
Yes. LiNK’s geographic analytics display a live map of every location where your card has been scanned or viewed, broken down by city and region. This lets you identify your networking “hot zones” — the markets and areas where your digital business card is generating the most interest. For professionals who attend conferences, trade shows, or regional networking events, geographic tracking reveals exactly which events and locations are driving real engagement versus one-time scans, so you can prioritize where to invest your networking time and travel budget. Granularity of location data is based on customer and client privacy settings.
How do I use the heatmap to improve my follow-up timing?
LiNK’s activity heatmap shows your card’s engagement broken down by day of the week and hour of the day, so you can see exactly when your contacts are most actively viewing your profile. To use it effectively, identify the time windows with the darkest cells — those are your peak engagement periods. Schedule your follow-up emails and outreach during those windows to reach prospects when they’re already thinking about you. You can also compare heatmaps across different time periods to measure the sustained impact of specific events. A spike on a Tuesday afternoon may align with a conference you attended, while consistent Thursday morning activity might indicate a specific contact segment worth prioritizing.
Is the analytics dashboard available on mobile?
Yes. The LiNK analytics dashboard is fully optimized for mobile and designed specifically for professionals who review their data on the move. The mobile dashboard is built for vertical scrolling and fast load times, so you can check your scan data, lead captures, and engagement trends between meetings, at a networking event, or in transit — without needing to open a laptop. Since LiNK is entirely web-based and requires no app download, your dashboard is accessible from any smartphone browser with a single tap.
Does LiNK analytics work for teams and business accounts?
Yes. LiNK for Business includes analytics visibility across your entire team, giving account administrators a centralized view of card activity, QR code scans, lead captures, and engagement data for every member under your business license. This makes it easy to identify your highest-performing team members, measure the ROI of specific events or campaigns, and ensure your whole organization is getting value from their digital business cards. Individual members retain access to their own personal analytics dashboard, while business account admins gain the broader team-level intelligence needed to make strategic networking decisions.