LiNK Advanced Analytics
Turn Every Handshake into Actionable Intelligence
Analytics At-a-glance
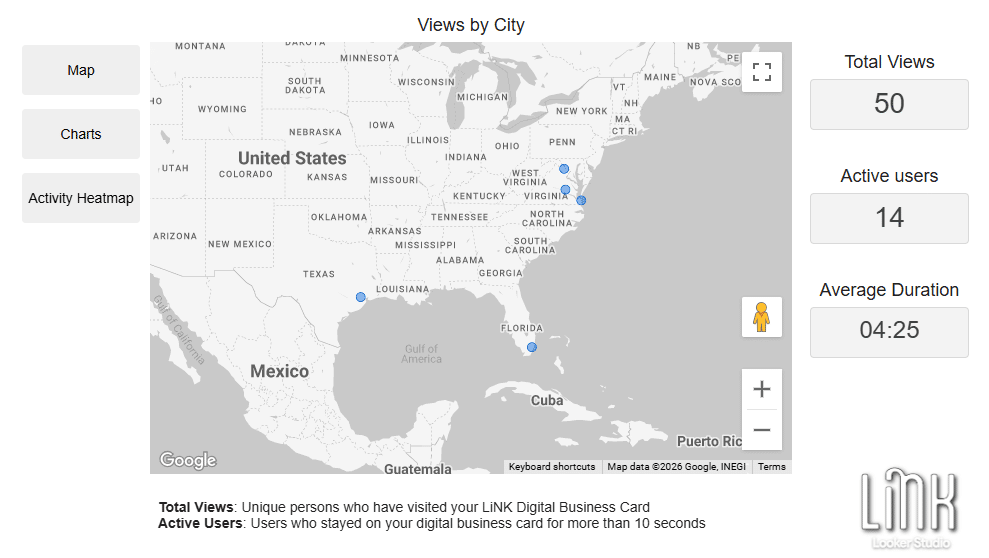
Global Reach, Local Impact
Geographic Footprint: View a live map of your networking “hot zones” to identify where your services are in highest demand.
Total Visibility: A high-level view of Total Scans gives you the raw reach of your networking efforts.
Engagement Depth: Track Average Session Duration to see how long prospects spend exploring your links, portfolio, and contact details.
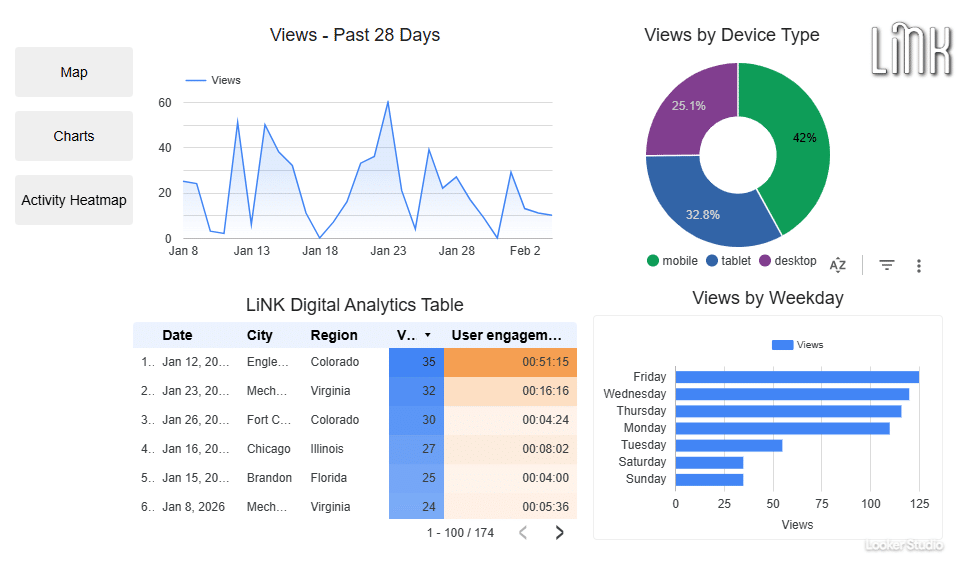
Networking Trends & Tech Insights
Growth Over Time: Track Daily View Trends to see the immediate impact of a conference, a social media post, or a specific networking event.
Interaction Velocity: Monitor Interactions Per Day to identify “engagement spikes”—helping you strike while the iron is hot and follow up when interest is at its peak.
Device Intelligence: See exactly what percentage of your audience uses iOS vs. Android. This allows you to optimize your contact-sharing strategy for the specific technology your prospects are holding.
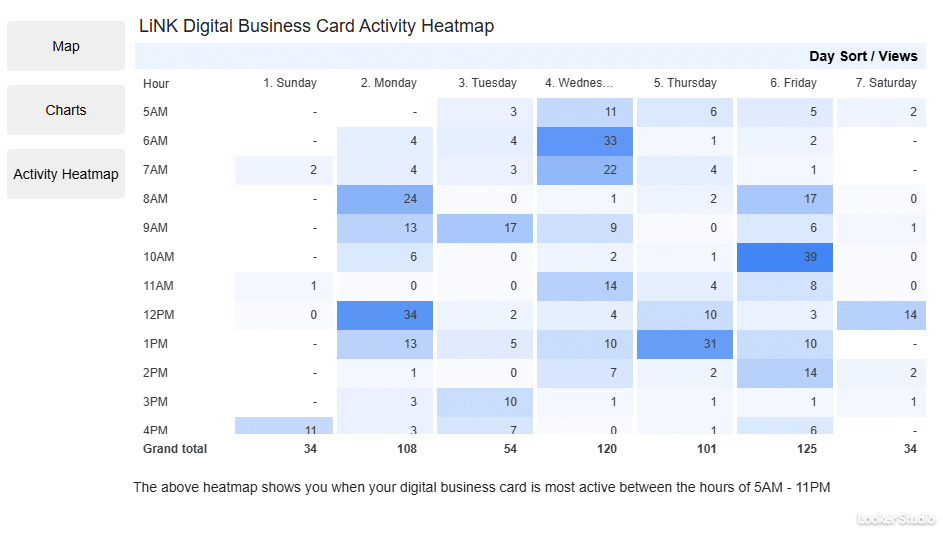
Peak Performance Timing
Engagement Hot Spots: Instantly identify your most productive networking windows. Whether it’s the “mid-conference rush” or “after-hours research,” you’ll see exactly when your audience is most active.
Strategic Follow-Ups: Use the heatmap to time your follow-up emails. Reaching out when your leads are historically most active on your card significantly increases your response rates.
Event ROI Analysis: Compare heatmaps across different dates to see which trade shows or networking mixers actually drove sustained interest versus a single momentary scan.
Networking with a Pulse
Networking happens on the move. Our dashboards are engineered for speed and vertical scrolling, so you can review your scan data between meetings or in the taxi.